User Tools
Sidebar
Table of Contents
Ping Plugin
The Ping Plugin lets you create Units that can ping devices on your local network or the internet. Much configuration is available for the number of pings, retries and how often you wish to ping the device. The Ping plugin was added to XTension in version 9.4.38 and is part of the default install. The Network Presence plugin is similar in that it will let you create units that can ping a device by IP address but it does not have the ability to control the timing or number of pings to send. It also pings every device on the network that it finds in the ARP table of the computer so that dynamically assigned IP addresses could be checked as well, this cannot be turned off so you are always sending a lot of ping traffic that is not strictly necessary. The Ping plugin does not yet have this last function. It can be added if needed please let me know. The Network Presence plugin should be considered to be deprecated in favor of the newer Ping plugin.
XTension Settings:
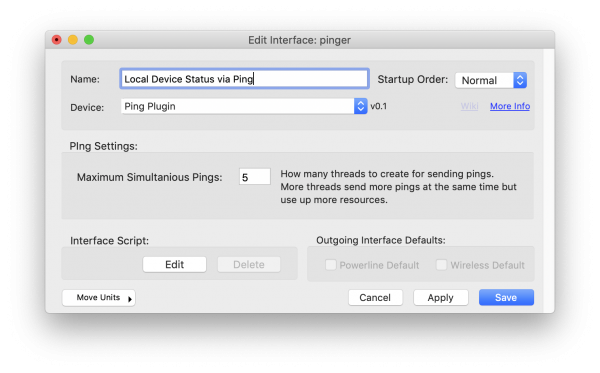
Create a new interface from the Interface List window and select “Ping Plugin” from the Device/Plugin popup.
Maximum Simultaneous Pings: controls how many threads are created to send pings. More threads sends more pings at once but uses more resources. If a thread is not available when a Units ping timing comes up it will queue up it’s request and run as soon as a thread is available. This means that your pings may not run exactly when the time is up but will do so within a few seconds. It is not necessary to have as many threads as you have ping Units, generally 5 is fine.
Once you have created the Interface save it and enable it in the Interface list window. Now you are ready to create units corresponding to the network availability of various local devices.
Ping Unit Settings:
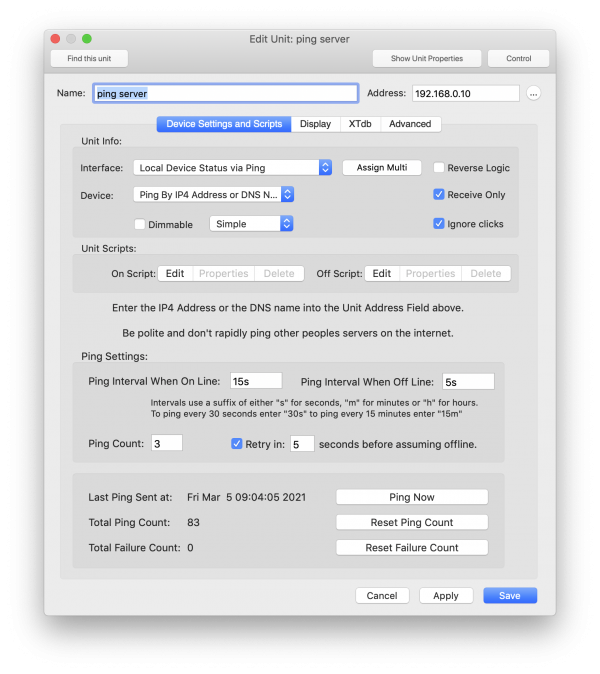
You can create any number of Ping units. Create a new unit and select the Interface you just created in the Interface popup. At this time the Ping plugin defines only a single Device or Unit type: “Ping By IP4 Address or DNS Name” and it will be selected automatically when you select the interface from it’s popup.
Place either the IP4 address or the DNS name in the Address field of the Unit.
You should also check the Receive Only and Ignore Clicks checkboxes as these units are inherently receive only. The Unit should not be made dimmable.
Ping Timing Both ping timing fields use a shorthand for defining the amount of time. It is a number followed by a letter suffix and if you separate them with a space you can use any number of entries. The suffix is required even for seconds. Supported suffixes are “s” for seconds, “m” for minutes and “h” for hours. If you wished to ping every 15 minutes you would enter “15m” in the field. If you wished to ping every 5 seconds you would enter “5s” in the field. If you wished to ping every minute and a half you would enter “1m 30s” etc.
Ping Interval When On Line: The time between sending pings while the device is online and functioning normally. You may wish to ping less quickly in this normal case to reduce unnecessary traffic, especially when pinging out to the internet, at the cost of finding out less quickly when the device is offline.
Ping Interval When Off Line: Once a device has been found to be offline you can ping more rapidly to know more quickly when it comes back online.
Ping Count: The number of pings to send. Sending a single ping is rarely a good idea as they are low priority traffic and one ping may get lost more easily than several. The default is 3 but you can send more if you wish.
Retry in: Sometimes a device will fail to respond to a ping for a short time due to either network conditions or it’s own internal state. I have some devices that would bounce from offline to immediately back on every so often even though they were actually functioning normally. If this checkbox is set then the device will be re-pinged in that number of seconds and both must fail in a row before it will be considered offline. Note that this “seconds” field does not use the Ping Interval timing notation. Just enter a number with no suffix.
Ping Now this button is available from the Edit Unit dialog as well as the popup quick control window for a Ping unit.
Reset Ping Count the total number of ping events sent is recorded and also saved to a Unit Property. You can reset it via the scripting command below or by clicking this button. Note that this is not the actual number of individual ping packets sent, but the number of times the ping command was executed. You may be sending 10 pings, but each time you do this number will increment by 1.
Reset Failure Count the total number of ping failures. This counter is also saved to a Unit Property. You can reset it via the scripting command below or by clicking this button.
Scripting Commands:
The Ping Now command and the 2 reset statistics commands are also available from scripts.
To force a ping from a script:
tell xUnit “name of your ping unit” to pingNow()
To reset the statistics via a script:
tell xUnit “name of your ping unit” to resetTotalPingCount()
tell xUnit “name of your ping unit” to resetFailCount()
Unit Properties and Ping Statistics:
All the statistical data about each ping event and the totals are saved to Unit Properties. The output from a ping command might look like this:
ping -c3 192.168.0.1
PING 192.168.0.1 (192.168.0.1): 56 data bytes
64 bytes from 192.168.0.1: icmp_seq=0 ttl=64 time=7.378 ms
64 bytes from 192.168.0.1: icmp_seq=1 ttl=64 time=11.350 ms
64 bytes from 192.168.0.1: icmp_seq=2 ttl=64 time=0.599 ms

--- 192.168.0.1 ping statistics ---
3 packets transmitted, 3 packets received, 0.0% packet loss
round-trip min/avg/max/stddev = 0.599/6.442/11.350/4.439 ms
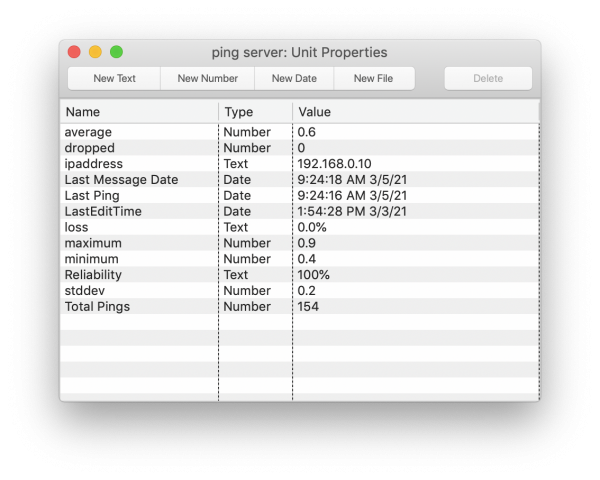
ipaddress If you entered a DNS name in the Address field of the unit the resolved IP address will be placed in the “ipaddress” field.
Last Ping A date property when the last ping was sent to the device.
Total Pings A count of all the pings that have been attempted since you created the unit or last performed a reset of this field.
Last Failure A date property when the last ping attempt failed. (not pictured)
Failure Count A count of every failure since you created the unit or last performed a reset of this field. (not pictured)
The next group of values will change with each ping attempt: minimum The value from the “min” output above. The fastest that a ping was returned in ms.
average the average value of all the pings sent in the most recent attempt.
maximum the longest it took to return any of the pings in the more recent attempt.
stddev the standard deviation between all the pings in the most recent attempt.
dropped the number of pings dropped in the last attempt. All pings have to be dropped before the unit is considered offline but it may be useful to see if some number of the pings less than all of them are being dropped.
loss the percent loss of the pings. Will be 0% if all pings were received or 100% if all were dropped.
Reliability is a special value. The last 255 ping attempts results are saved and averaged together to get this value. If a single ping in the attempt is dropped this value will be decremented.
Note that you cannot reset the Total Pings or Failure Count properties by using the set unit property verb. You must use the interface buttons or the scripting commands mentioned above.
Saving Statistical Data For Graphing or other purposes
You can get access to the properties as they change via the Property Changed handler in the units On script:
on PropertyChanged( theName, theValue)
   if theName = “average” and theValue > 10 then
      write log (thisUnit) & “ is returning very slow pings average: “ & theValue color red
   end if
end PropertyChanged
All properties as they are updated with each ping will be passed to this handler and you can check for any of them that you wish.
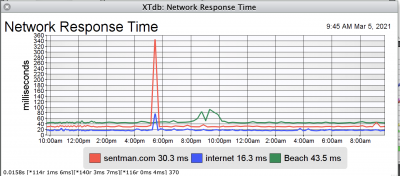
It is also possible to move any interesting statistics out to separate pseudo units in order to be able to graph them as in this example. In this example the average value is moved out to pseudo units for graphing. First create the pseudo unit, make it dimmable and give it a descriptive name something like “router ping average time”
In the On Script of the router ping object (not the pseudo you just created) you need to use the propertyChanged event to catch the value you want and put it into the pseudo unit:
on propertyChanged( theName, theValue)
   if theName = “average” then
     set value of “router ping average time” to theValue
   end if
end propertyChanged
The average time of every ping attempt will now be set to the pseudo unit and stored in XTdb so that you can create graphs. Any of the unit properties may be moved to a separate unit for easier access in the same way.
Displaying More Information:
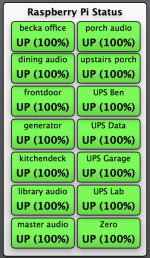 It is possible to display more info in various Views or lists by editing the On and Off labels for the device. In this example I am displaying the status and also the Reliability percentage in this view and web interface widget. To do this edit the On and Off labels in the Ping Unit something like this:
On Label: UP (<property name=“Reliability”>%)
Off Label: DOWN (<property name=“Reliability”>%)
You may also wish to setup custom colors for the unit in question so that the displays appear green when the unit is on and red when it is off which is the opposite of the default display colors. For the Red color I use “33FF33” and for the green color I use “FB0106” If you wish you can make the display be yellow if the value is anything less than 100%. In the screen shot of unit properties the Reliability is a text value with the % at the end. In the release version that has been changed to a number so that easier comparisons can be made. In order to make this work you need another block of code inside the on propertyChanged handler something like this:
on propertyChanged( theName, theValue)
   if theName = “Reliability” then
     if theValue = 100 then
       set xtOnColor of xUnit (thisUnit) to “33FF33"
     else
       set xtOnColor of xUnit (thisUnit) to “FFFF33"
     end if
   end if
end propertyChanged
All of these values can be set on the Display tab of the Edit Unit Dialog. The Advanced Label Syntax is detailed on that page. Many values can be pulled into the display.
Showing More Info in Unit Lists:
 Any Unit Property may be added to a Unit List as a column. This will display both in the app and on the web or other interfaces and be sortable in all those places as well. To add a custom column to a list window control click in the headers of the list and select “Insert Custom Column” enter the text you would like displayed in the header and then enter the property name from which to get the data or use the popup to select it if you selected a specific unit in the list before starting. If the property is a date then also select Property Is A Date so that it will be properly formatted given your list specific date formatting settings. You can add any number of custom columns to a list. In this example you see the advanced label showing up in the Value field as well as the custom Reliability column and the Date column of “Last Ping” I might also add total failures and last failure date to the list.
Converting From The Network Presence Plugin
No automatic conversion is done between the original Network Presence plugin and the new Ping plugin. In order to move your units create a new interface instance of the Ping plugin, but leave it disabled. Go in and edit your current Network Presence units. Change the Device/plugin popup to point to the new Ping instance. Edit any other ping settings that you wish and save the unit. When you’ve converted all the units you wish to you can then enable the ping plugin to begin using the new system. If you no longer need the Network Presence plugin you can then disable and delete the interface instance or keep it if you are also using it for the pinging of all devices on the local network by MAC address.
Converting back if needed is the same procedure. Edit the units and change their Device/Plugin popup back to the original Interface.
History:
* The Ping plugin was first added to XTension in version 9.4.38 in March of 2021

